Search
Are the results matching what the traveler is looking for?
Qunar · A Trip.com subsidiary
What happens when you listen to every traveler, at the exact moment something goes wrong, and trace it all the way to the business decision that caused it?
How it looks
Surveys are embedded in the live traveler journey, not sent after the fact. Each touchpoint is behavior-triggered, layered for attribution, and AI-powered for follow-up.
Are the results matching what the traveler is looking for?
Does the list make hotel comparison simple and trustworthy?
Does the detail page provide all information needed to decide?
Has the traveler compared price on another platform?
Anything Qunar can help prepare before arrival?
Does the stay match the information Qunar provided?
How likely is the traveler to book again?
Is the traveler satisfied with customer support?
Each demo keeps the original screenshot proportions. These are not wrapped in extra phone frames because the source visuals already carry the device context.
Asks whether the traveler will keep using Qunar, then asks why in an open text follow-up.
Asks whether the displayed hotel price is cheaper or more expensive than another platform.
Asks how the stay went directly from the order page while the experience is fresh.
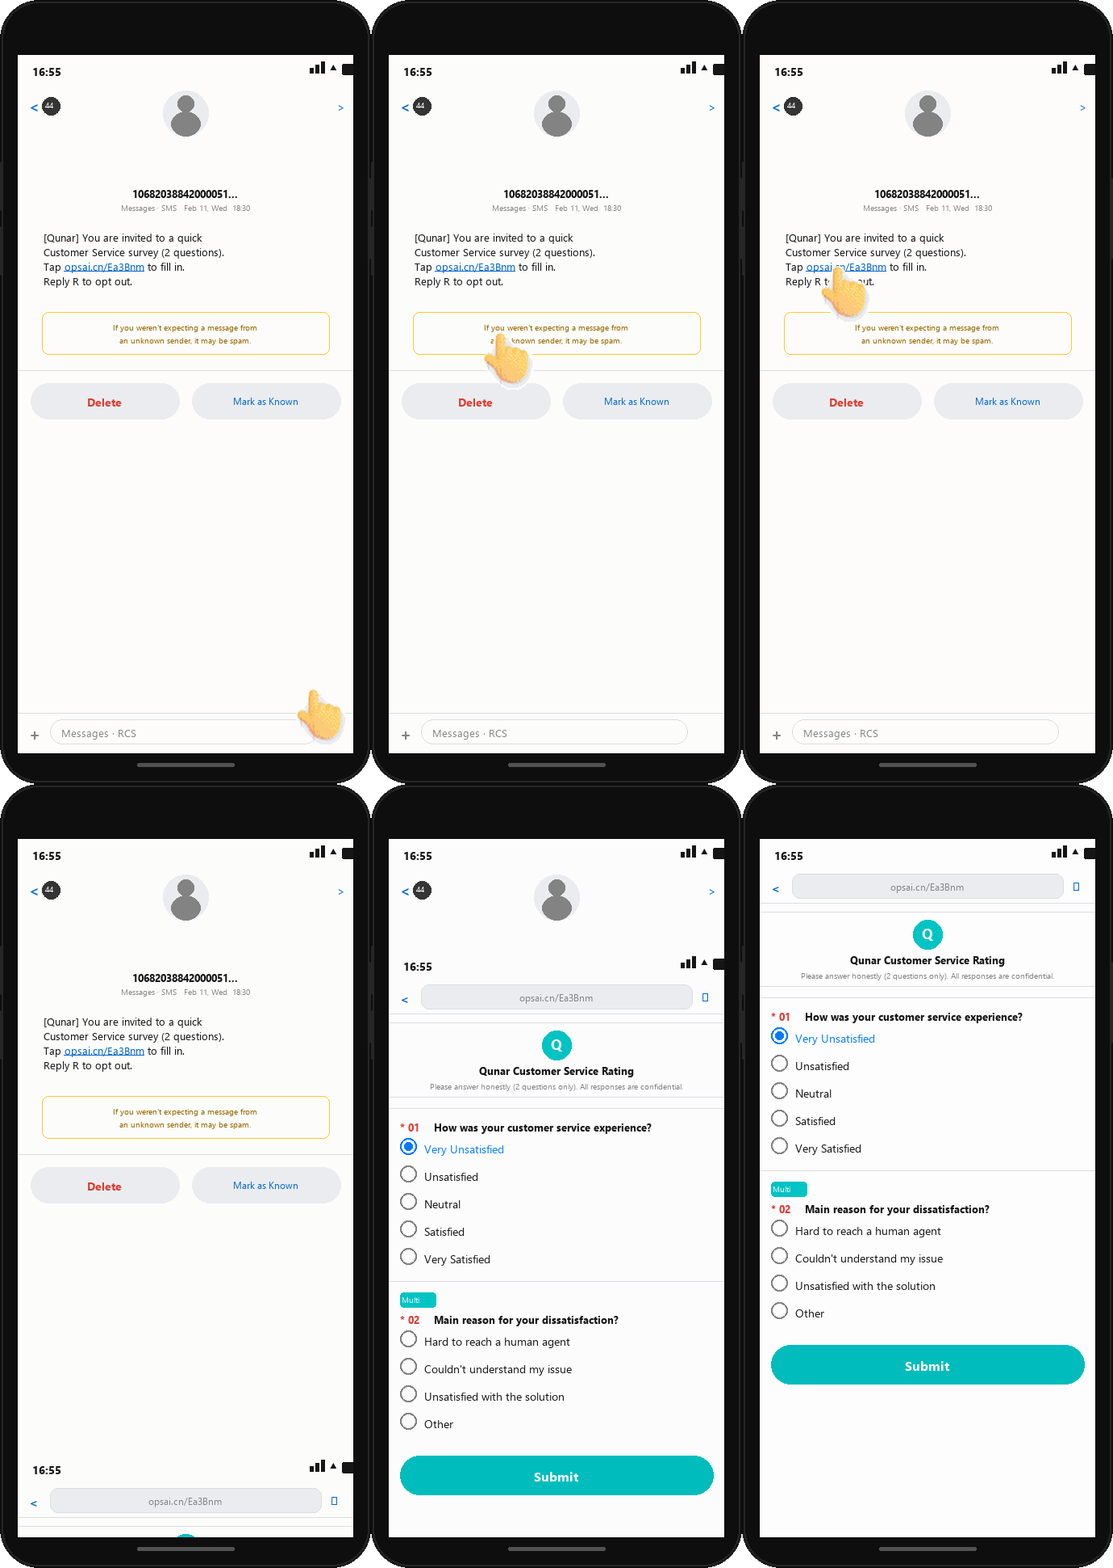
Asks service satisfaction from an SMS survey link after a support interaction.
Attribution model
V2V turns similar complaints into different actionable causes: two users may both say “the price is expensive,” but follow-up questions and taxonomy attribution separate a competitor price gap from a membership-discount perception gap.
URS captures the overall dissatisfaction and score movement.
AI follow-up identifies Price, Info accuracy, Service, or Product.
V2V drills to the specific operational scenario linked to internal systems.
The issue reaches the team responsible for changing the underlying decision.
Both users arrive with a “price is expensive” complaint. V2V follow-up and taxonomy attribution split that surface signal into different operational pain points, making the research result more useful for business action.
One traveler flags “price too high.” Follow-up clarifies that the same hotel was cheaper on Competitor B, mapping the issue to a competitor price gap.
Another traveler also complains about price, but the follow-up reveals a different pain point: the member price feels too close to a new-user offer, mapping the issue to membership value perception.
Business outcome
V2V’s impact compounds upward: massive real-time data drives attribution-led improvements, which lift satisfaction and connect directly to revisit behavior.
International hotel satisfaction increased YoY, creating over US$1M in related profit growth.
Improvement projects and issue sub-items launched across feature, pricing, and technology modules.
Million-level in-app reach, with 30K+ users participating in V2V surveys every day.
Survey programs deployed across the traveler journey, with coverage 9x the prior NPS questionnaire.
URS is highly correlated with users' revisit behavior.
“Revenue growth without experience growth is not sustainable.” Qunar CEO · quarterly business review
Business teams are evaluated on V2V impact and revenue growth. Experience becomes a primary accountability metric.
Leaders who grow revenue while satisfaction deteriorates are held accountable through a measurable operating system.
Validated voice is attributed to operational owners, correlated to financial metrics, and elevated to the business scorecard.
Industry impact
Within 18 months of V2V’s launch, multiple leading OTA platforms began implementing similar in-journey survey systems.
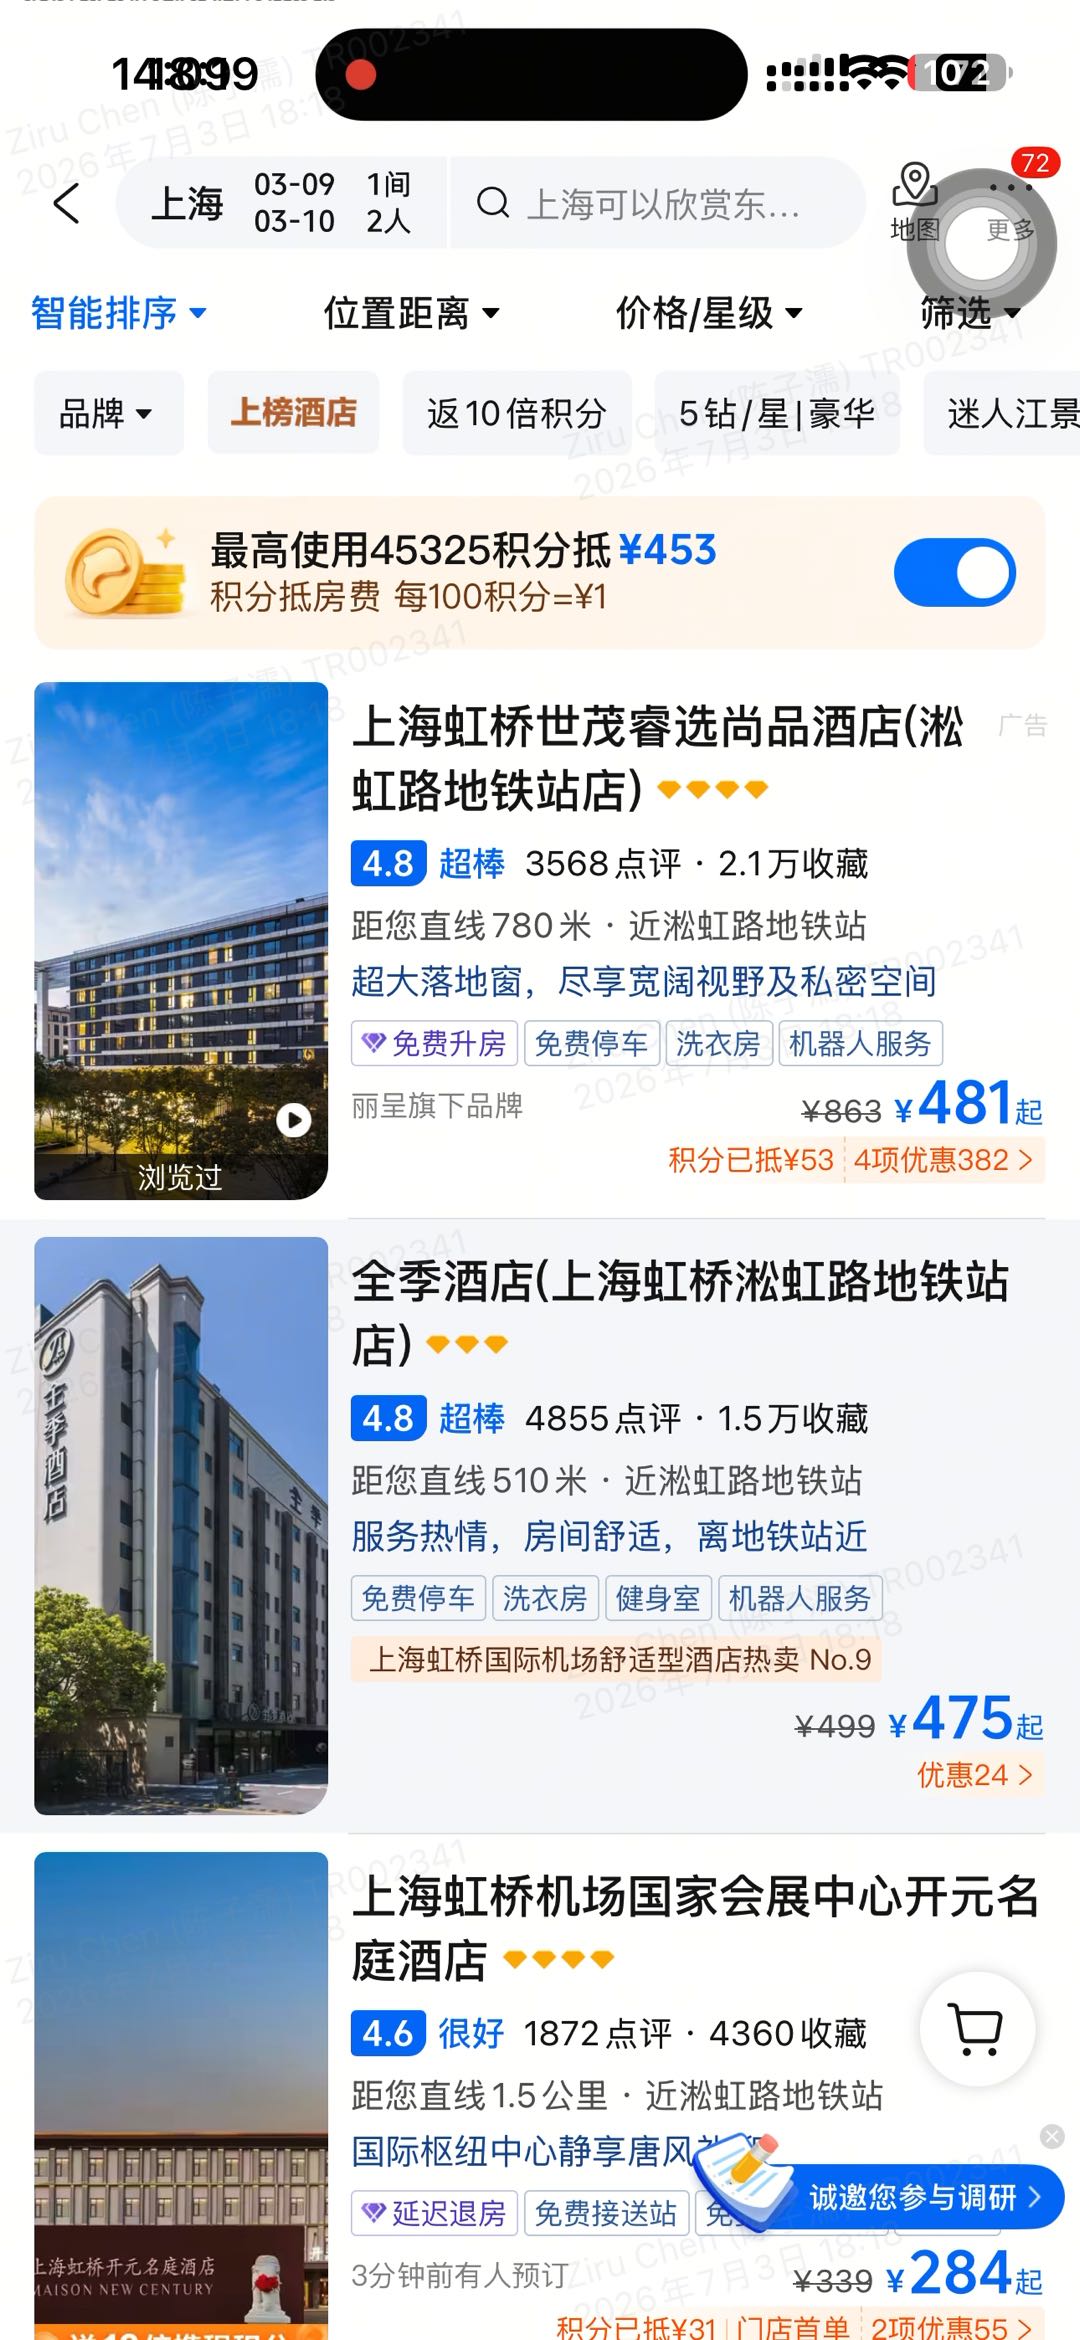
Competitor A, a leading China OTA, added a feedback trigger directly on the hotel list page, mirroring V2V’s in-journey listening placement rather than a post-trip survey.
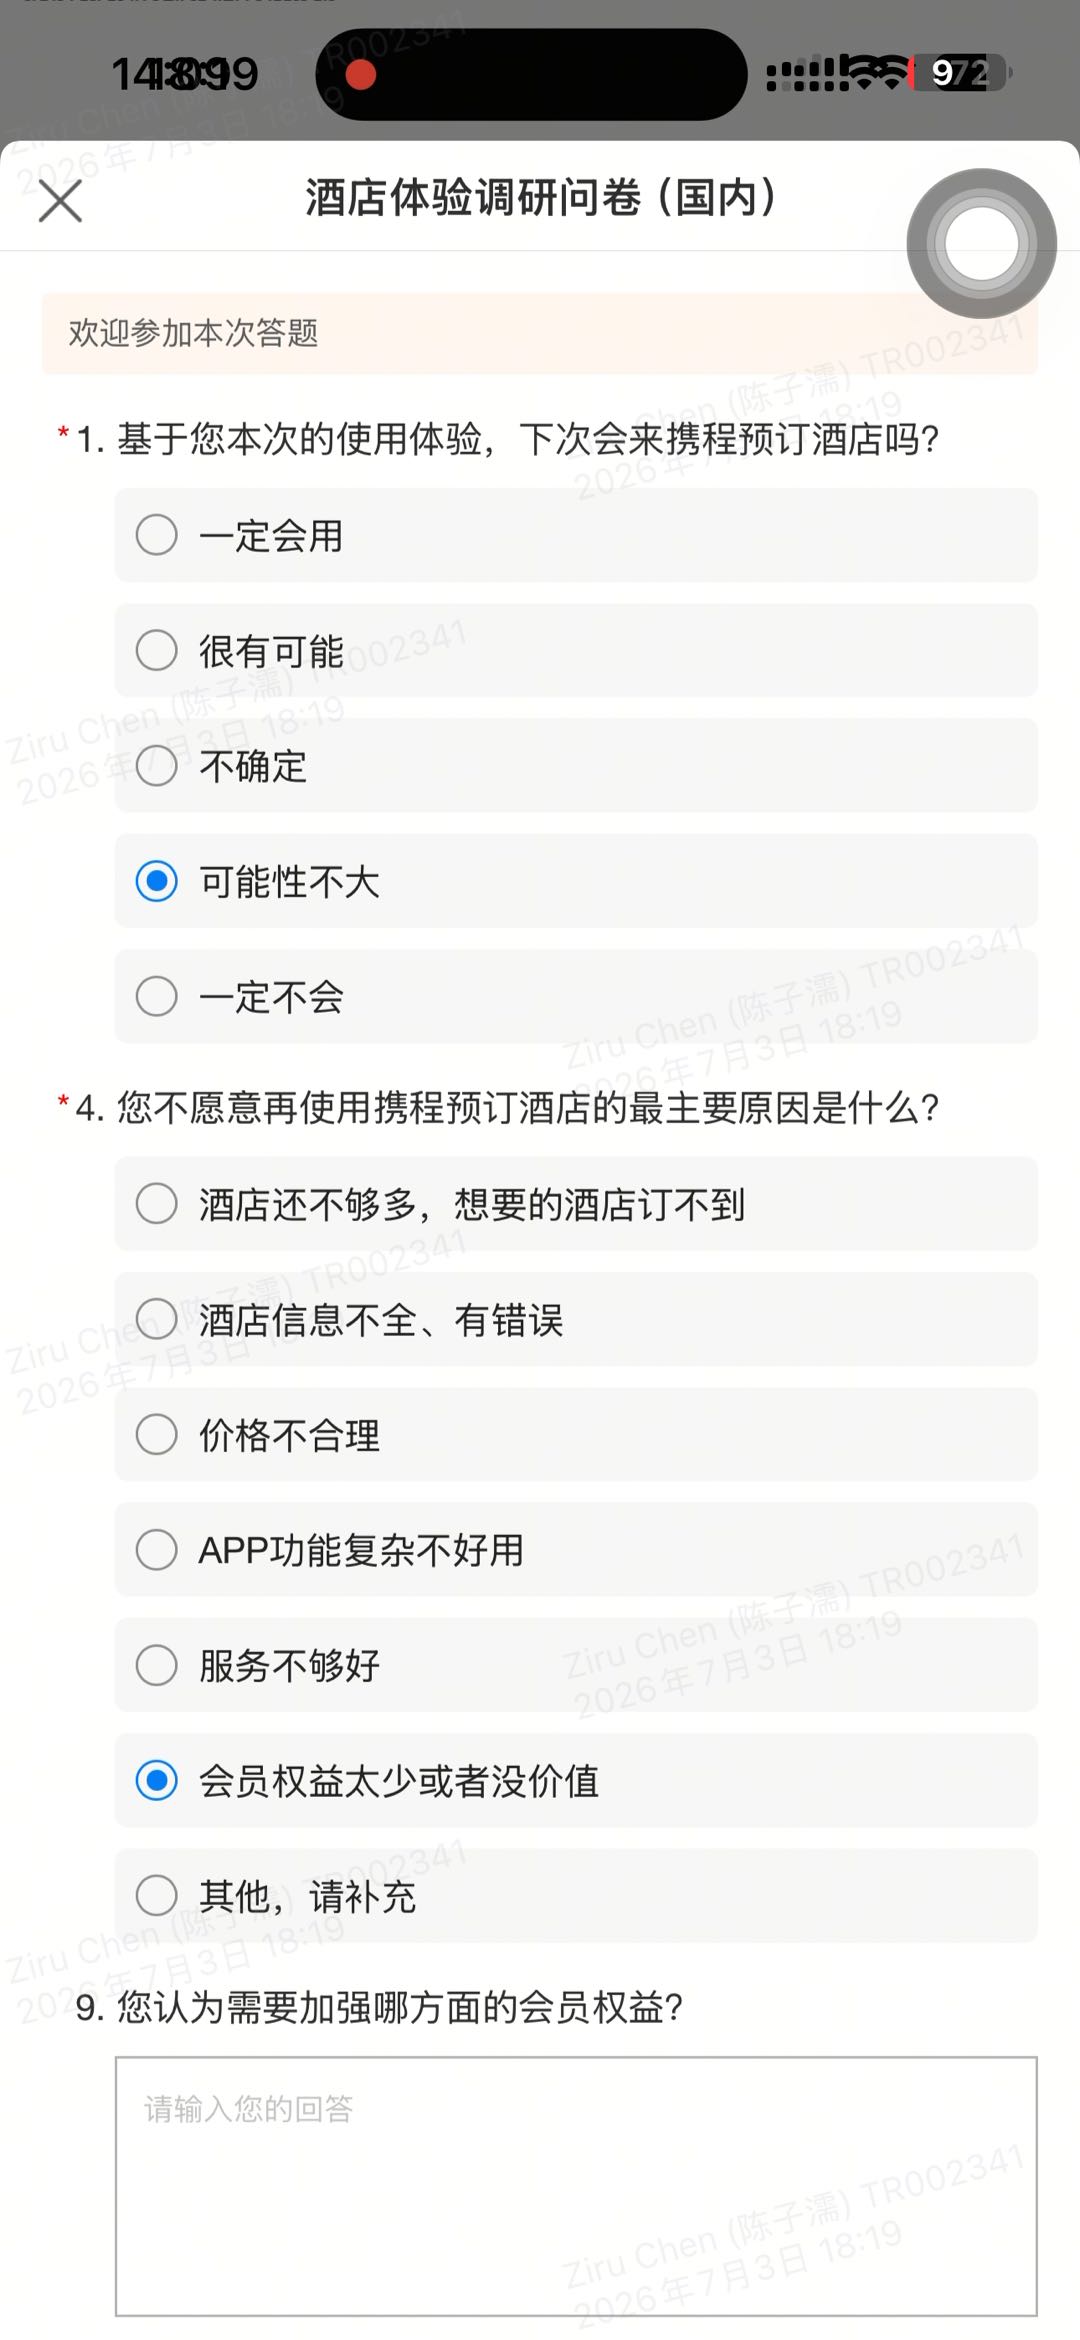
This view shows the list-page trigger after expansion: a structured URS questionnaire that asks for the user’s reason while the context is still fresh.
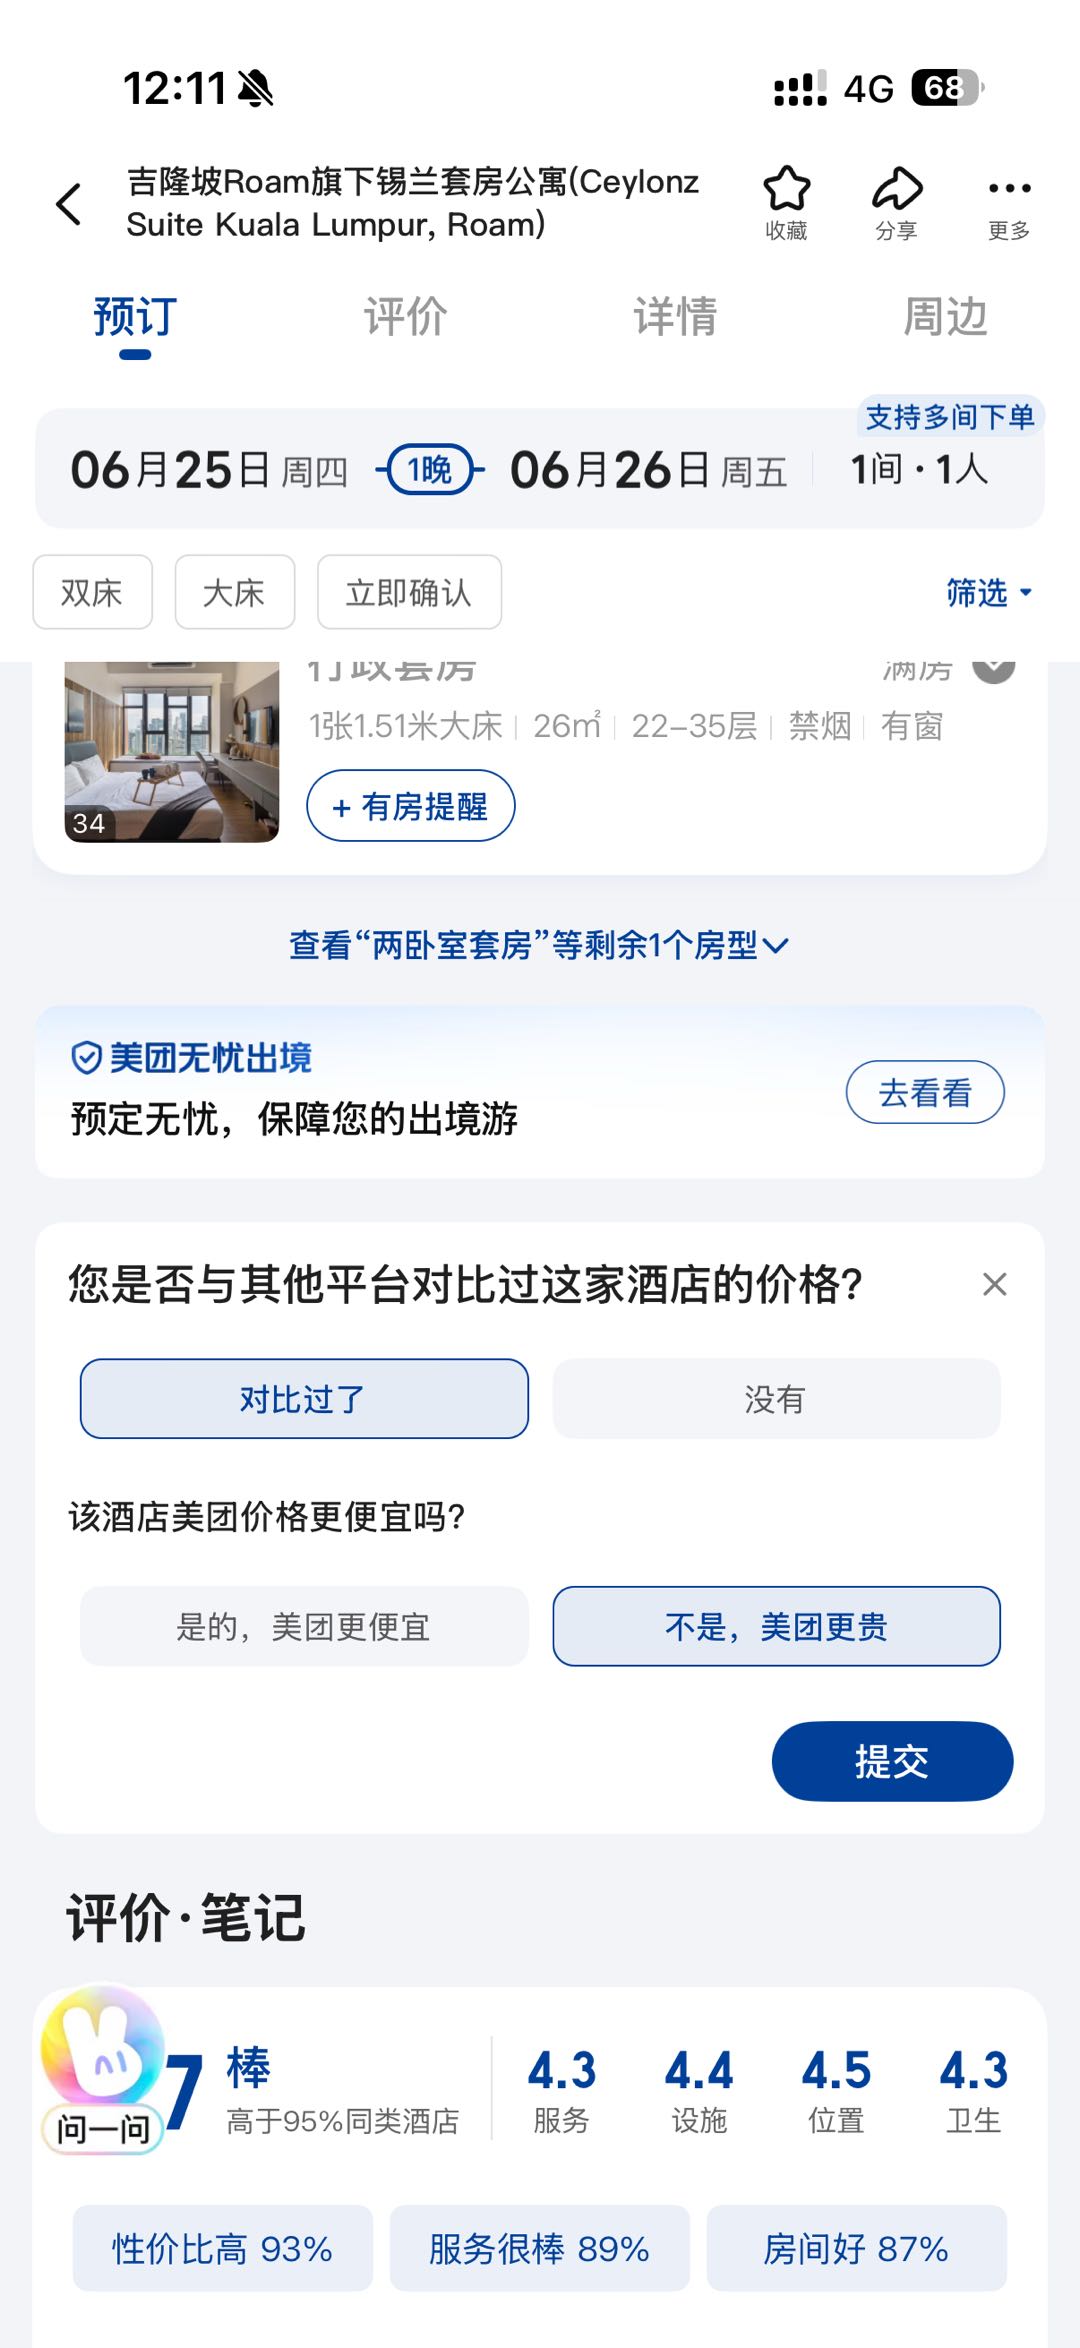
Competitor B is one of China’s leading OTA platforms and a major Qunar competitor, adopting a comparable competitive-price feedback loop.
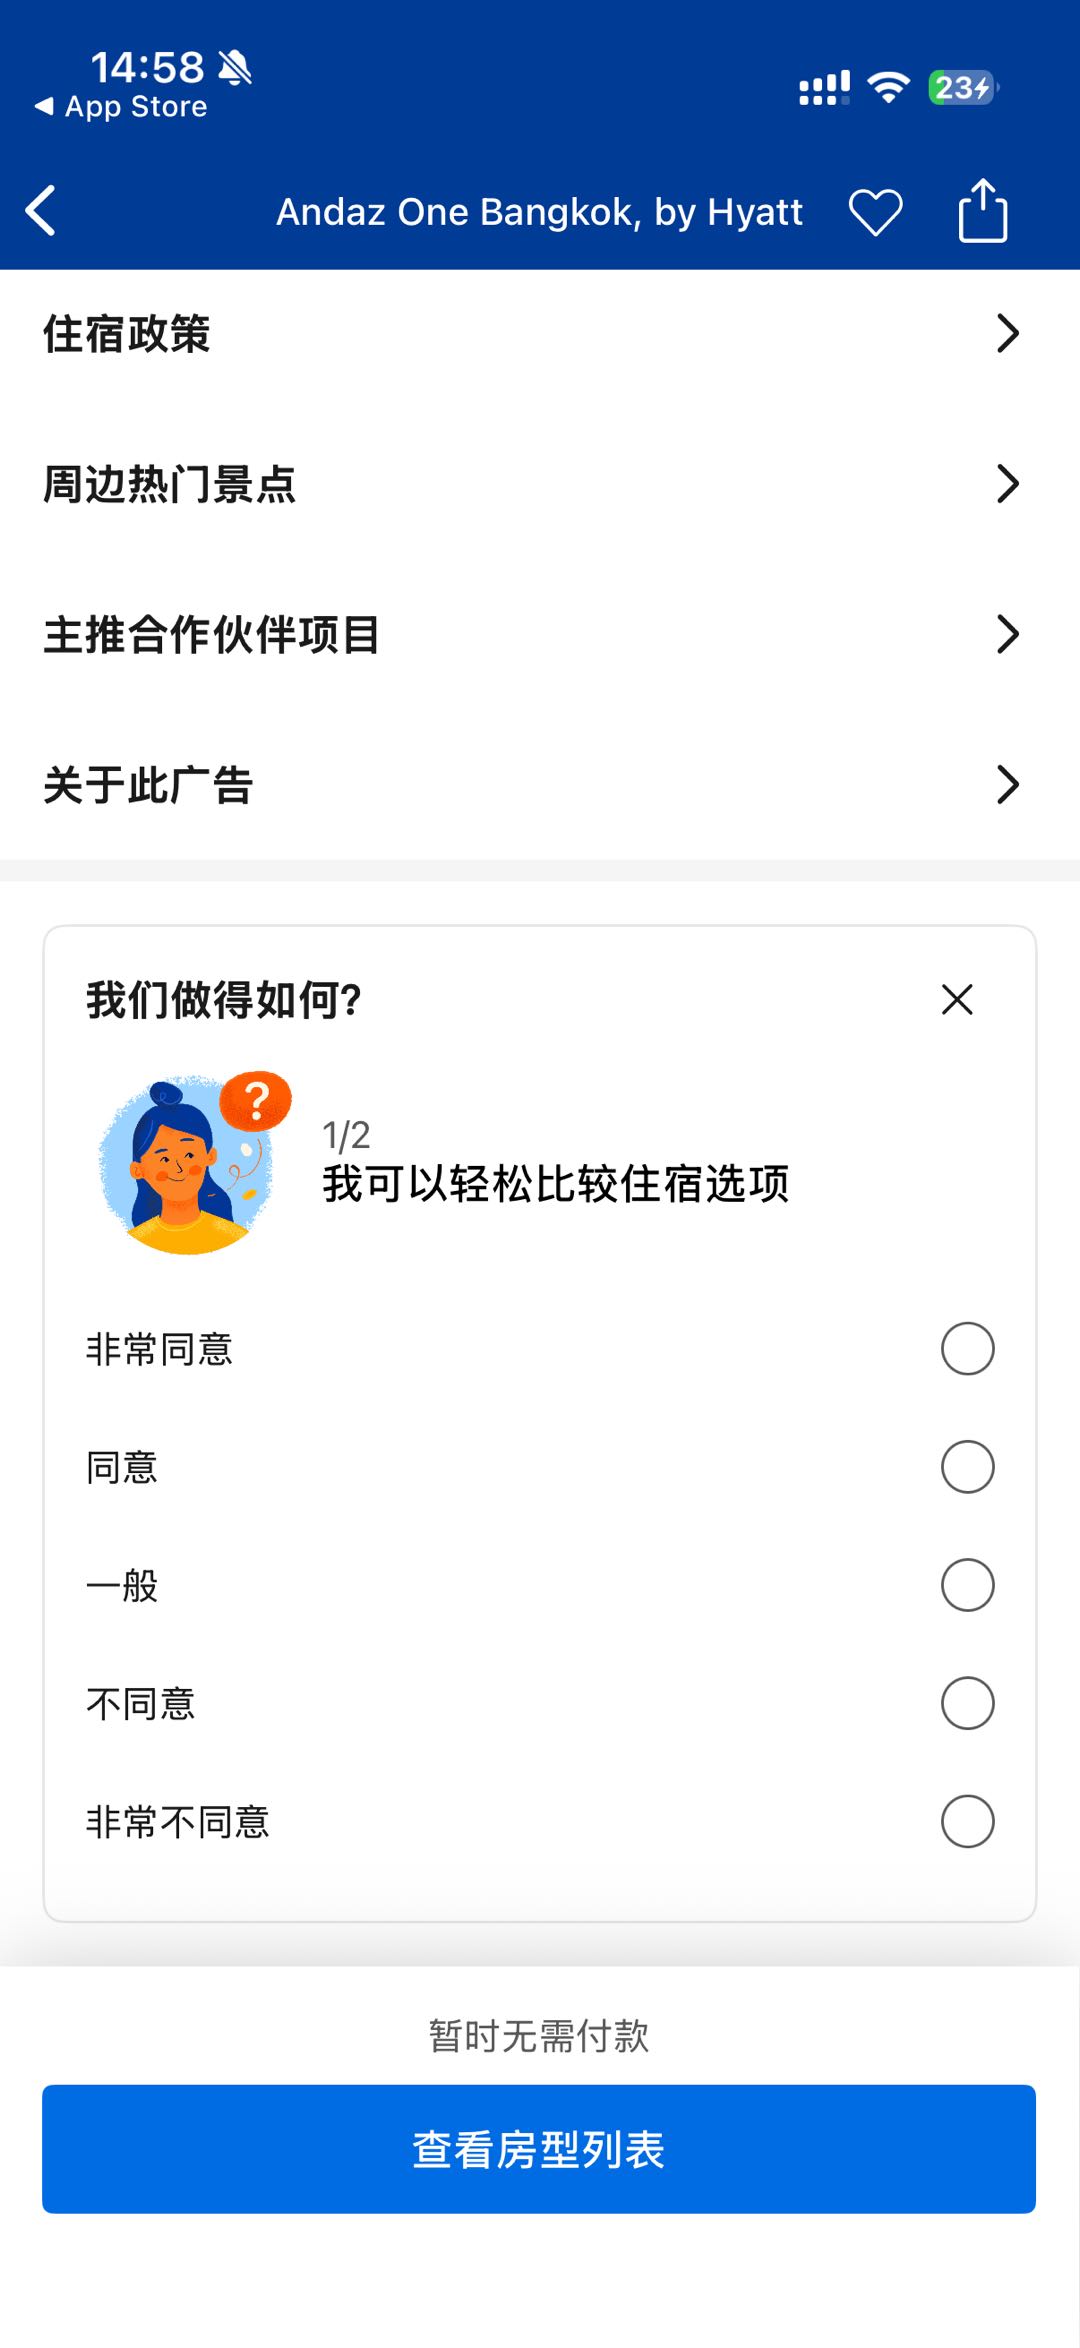
Competitor C is a global OTA benchmark, with contextual satisfaction capture appearing inside the booking and stay journey.
Media
Reuters and CCW visibility, presented as proof of industry momentum.
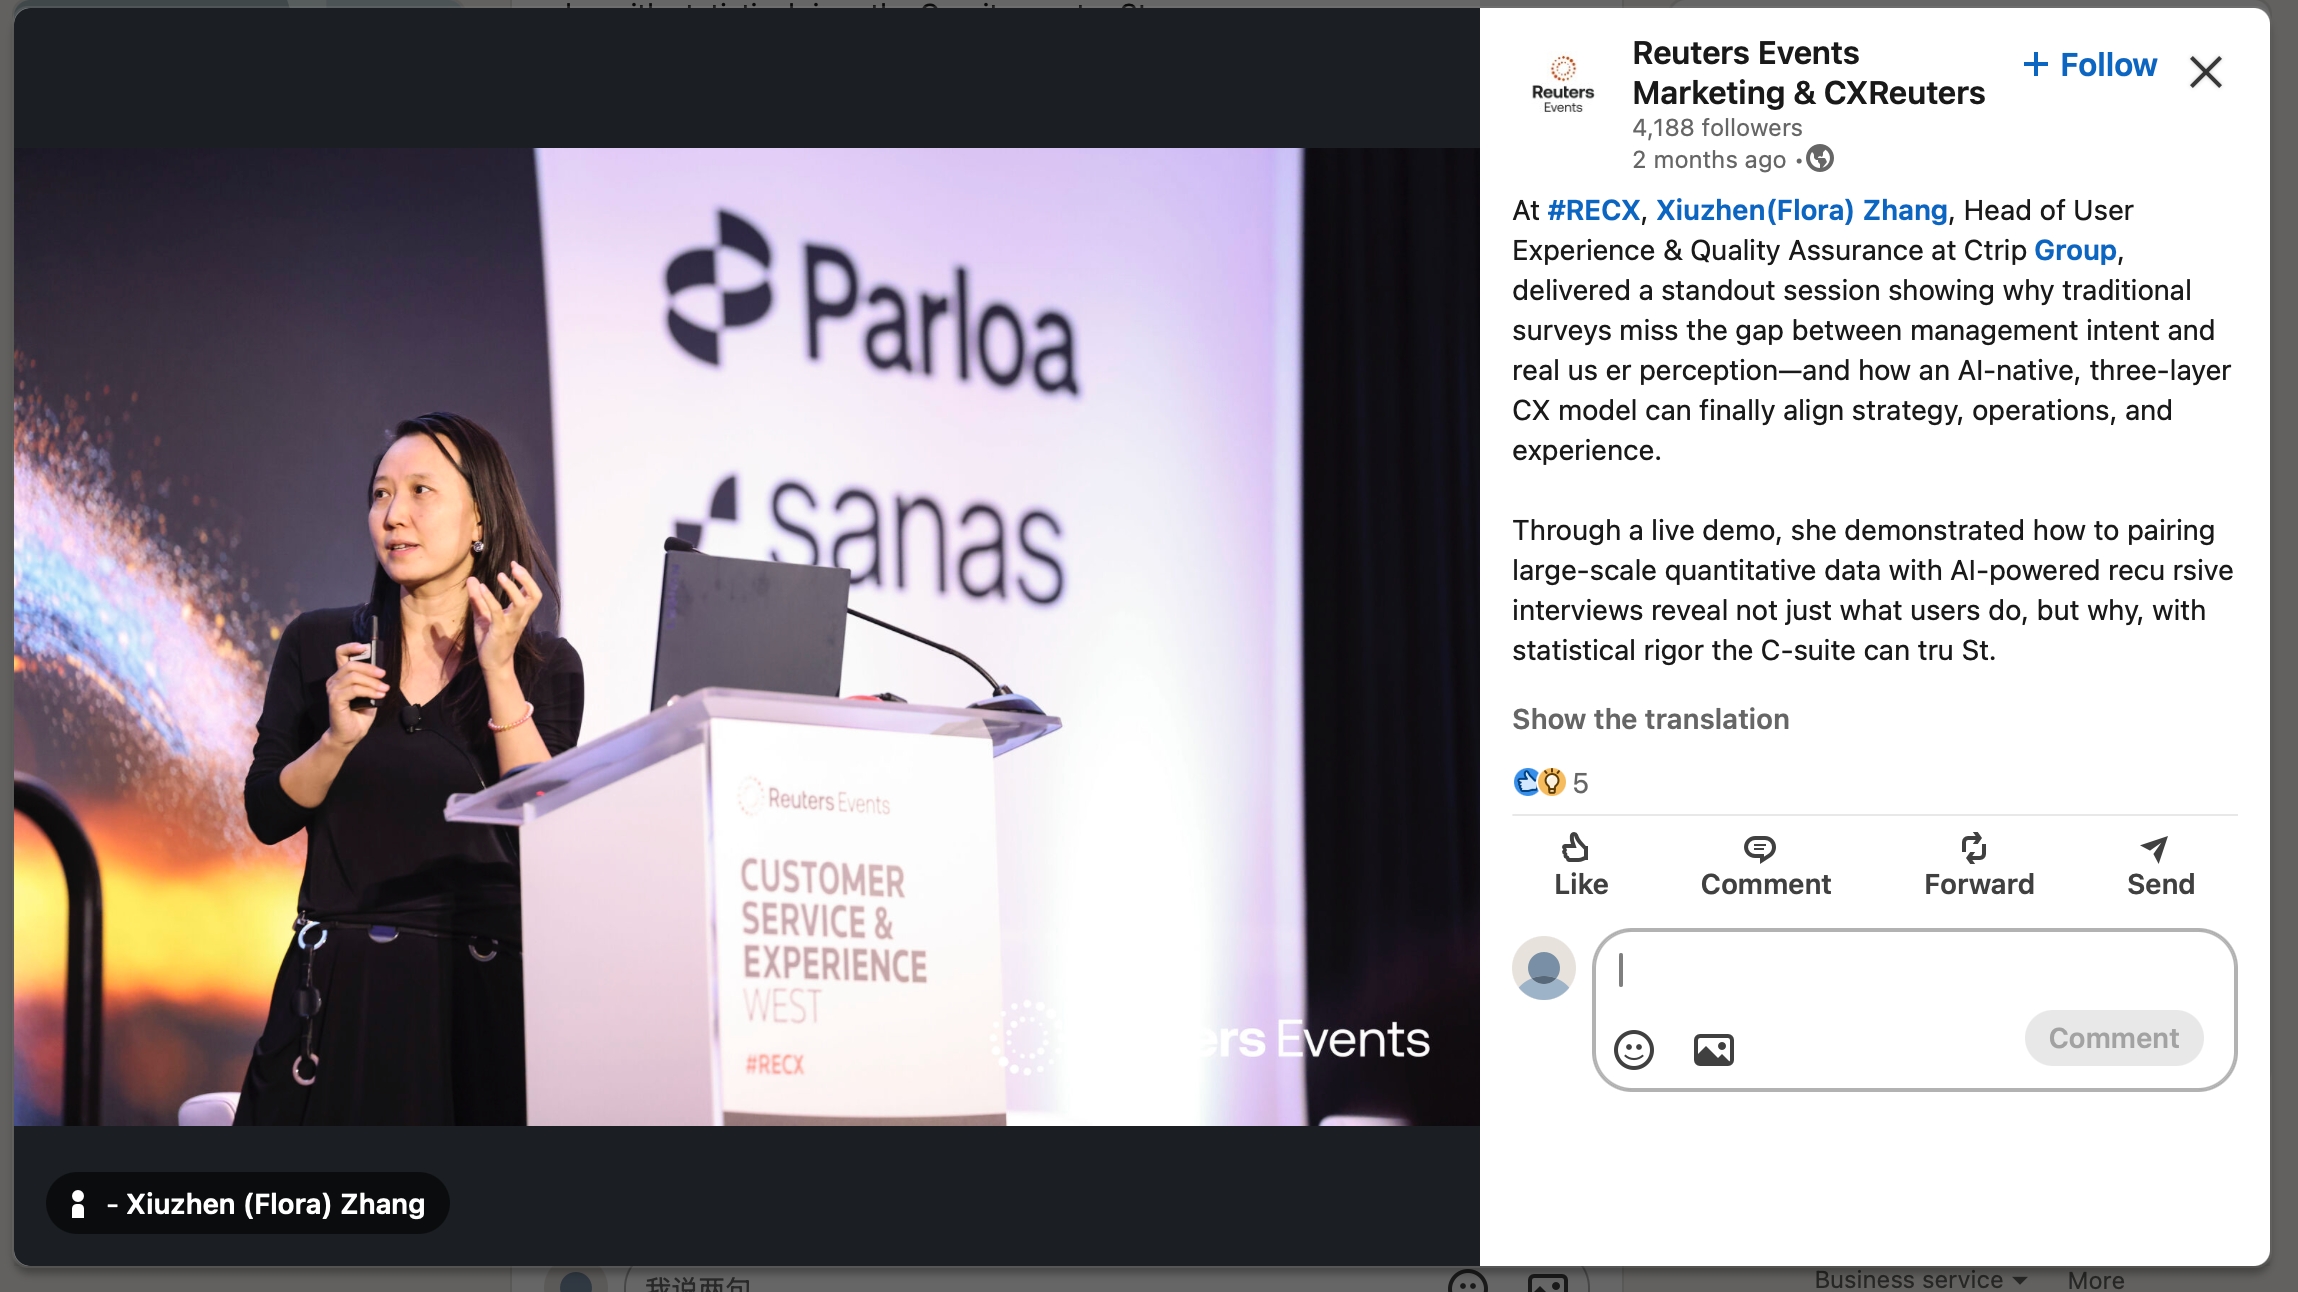
Reuters Events · Featured speaker
Reuters Events spotlighted Flora Zhang’s session on why traditional surveys miss the gap between management intent and real user perception.

Flora Zhang listed among global CX and AI transformation speakers.
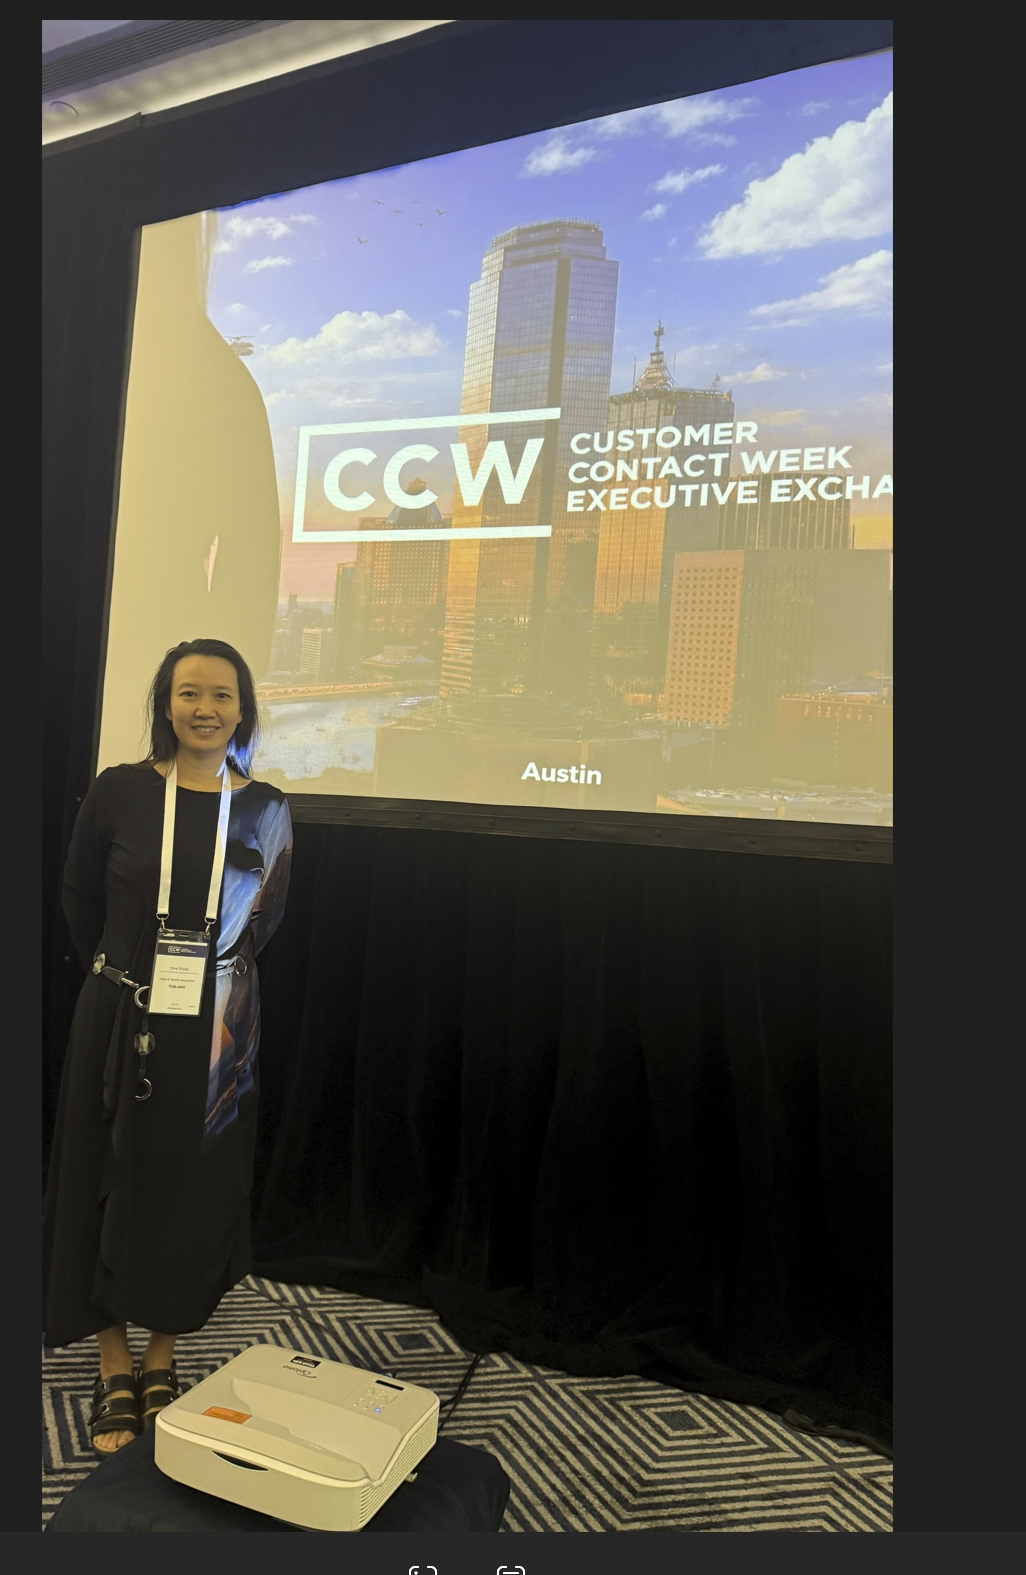
Forum presence reinforcing V2V’s industry relevance beyond Qunar.
Qunar V2V connects live traveler feedback, AI-powered attribution, operational accountability, and measurable business outcomes.